Blood pressure level (Indicator 11)
Last update
The indicator describes the following: Mean systolic blood pressure among adults.
This indicator is part of Target (6): A 25 per cent relative reduction in the prevalence of raised blood pressure (or contain the prevalence of raised blood pressure, according to national circumstances).
To determine blood pressure levels and their distribution throughout the population, blood pressure measurement must be carried out via population studies. This is done in the Health Surveys in Tromsø and Nord-Trøndelag.
Results
Blood pressure levels have been falling in all age groups since the mid 1990s. This is shown in results from the Tromsø Study and the Health Survey in Nord Trøndelag (HUNT).
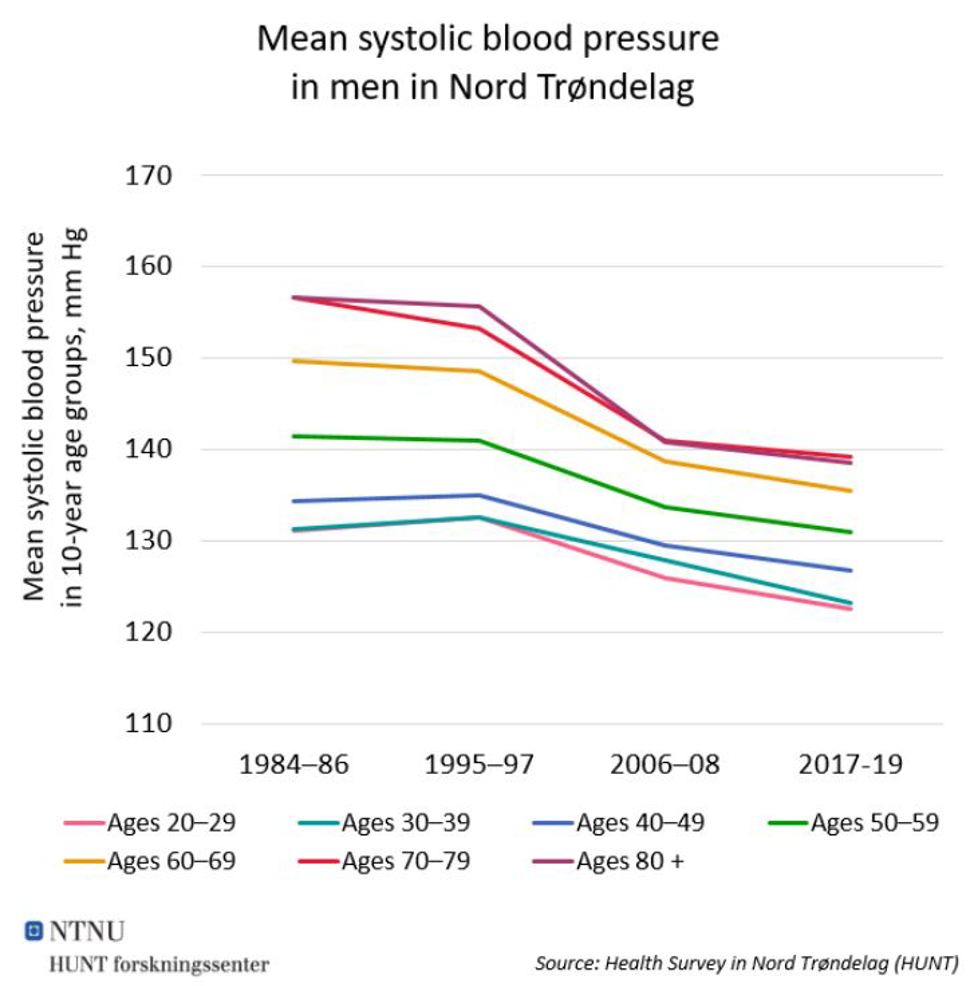
Figure 1: Mean systolic blood pressure in 10-year age groups of men, mm Hg. Source: Health Survey in Nord Trøndelag (HUNT). See table below.
|
|
1984–86 |
1995–97 |
2006–08 |
2017-19 |
|
Ages 20–29 |
131 |
133 |
126 |
122 |
|
Ages 30–39 |
131 |
133 |
128 |
123 |
|
Ages 40–49 |
134 |
135 |
129 |
127 |
|
Ages 50–59 |
141 |
141 |
134 |
131 |
|
Ages 60–69 |
150 |
149 |
139 |
135 |
|
Ages 70–79 |
157 |
153 |
141 |
139 |
|
80+ years |
157 |
156 |
141 |
138 |
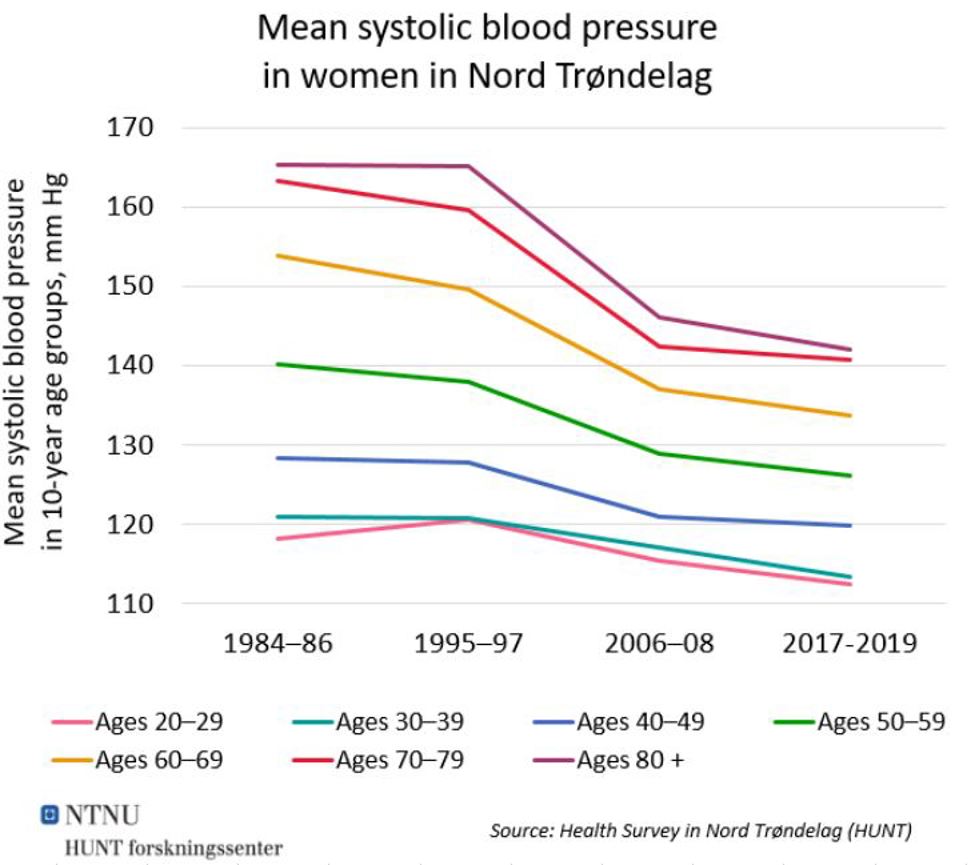
Figure 2: Mean systolic blood pressure in 10-year age groups of women, mm Hg. Source: Health Survey in Nord Trøndelag (HUNT). See table below.
|
|
1984–86 |
1995–97 |
2006–08 |
2017-19 |
|
Ages 20–29 |
118 |
121 |
115 |
113 |
|
Ages 30–39 |
121 |
121 |
117 |
113 |
|
Ages 40–49 |
128 |
128 |
121 |
120 |
|
Ages 50–59 |
140 |
138 |
129 |
126 |
|
Ages 60–69 |
154 |
150 |
137 |
134 |
|
Ages 70–79 |
163 |
160 |
142 |
141 |
|
80+ years |
165 |
165 |
146 |
142 |
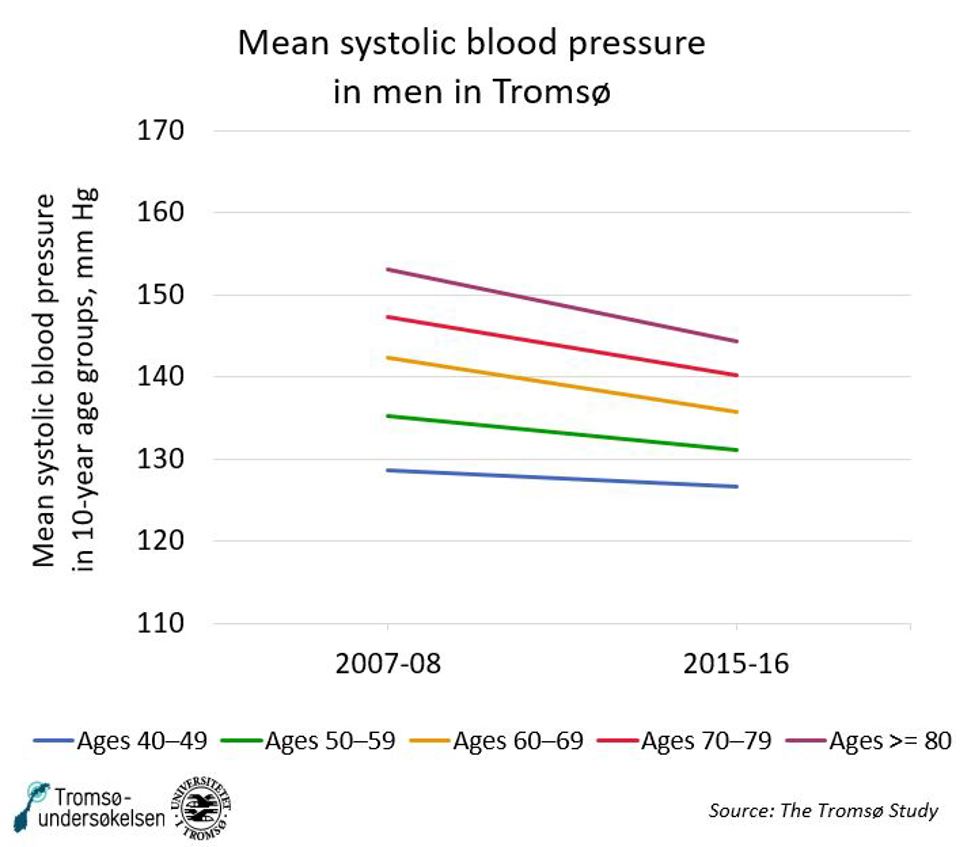
Figure 3: Mean systolic blood pressure in 10-year age groups of men, mm Hg. Source: Tromsø Study. See table below.
|
|
2007–08 |
2015–16 |
|
Ages 30–39 |
128 |
|
|
Ages 40–49 |
129 |
127 |
|
Ages 50–59 |
135 |
131 |
|
Ages 60–69 |
142 |
136 |
|
Ages 70–79 |
147 |
140 |
|
Ages >=80 |
153 |
144 |
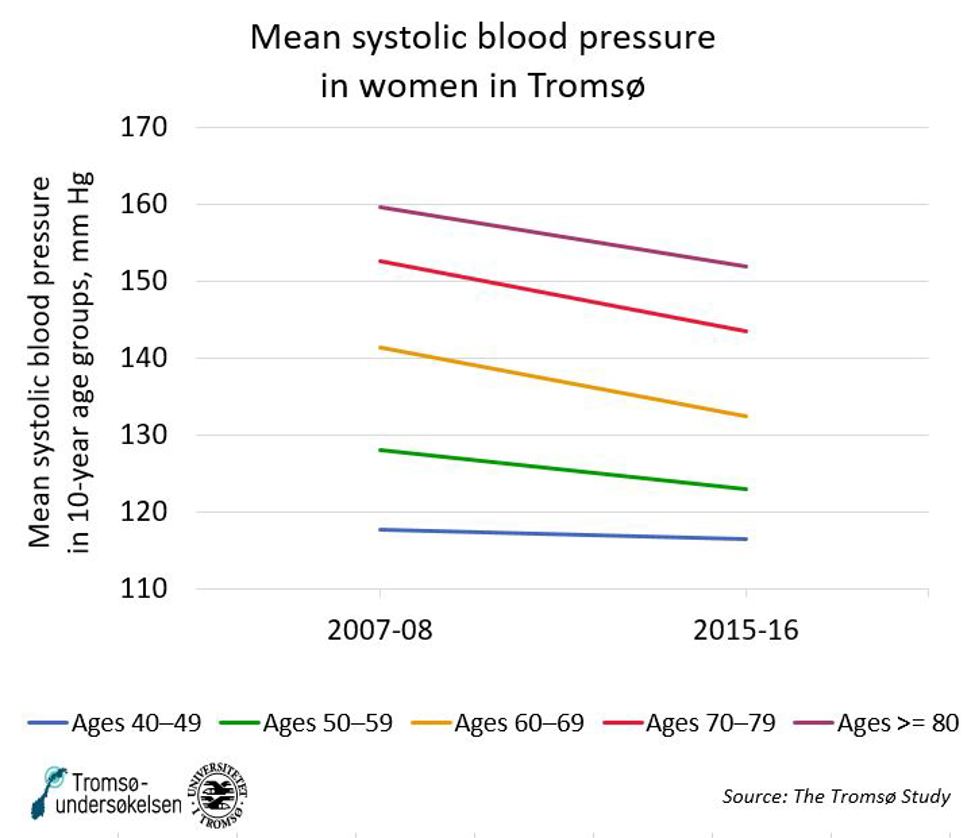
Figure 4: Mean systolic blood pressure in 10-year age groups of women, mm Hg. Source: Tromsø Study. See table below.
|
|
2007–08 |
2015–16 |
|
Ages 30–39 |
113 |
|
|
Ages 40–49 |
118 |
117 |
|
Ages 50–59 |
128 |
123 |
|
Ages 60–69 |
142 |
133 |
|
Ages 70–79 |
153 |
144 |
|
Ages >=80 |
160 |
152 |
Data sources
The data sources for this indicator are the Tromsø Study and HUNT
A description and definitions follow below.
Data source: Tromsø Study
Description
The Tromsø Study started in 1974 and consists of repeated health surveys on Tromsø municipality’s population. The last two studies are particularly relevant to the period WHO would like Member States to report on: 2010-2030. Tromsø 6 (2007-2008) included almost 13 000 adults between the ages of 30 and 87, and had an attendance rate of 63 per cent. Tromsø 7 (2015-2016) included more than 21 000 adults aged 40 and older, and had an attendance rate of 65 per cent.
Effect measure
- Mean measured systolic blood pressure for 10-year age groups of women and men, in mm Hg.
Interpretation and sources of error
The higher age groups contain many individuals who use antihypertensive drugs. This is one of the contributing factors to lowering blood pressure levels among the population.
To make observations about blood pressure trends within the population, irrespective of antihypertensive treatment, we can look at blood pressure levels in the youngest age groups, in which few individuals use antihypertensive drugs.
The proportion of individuals attending health checks has gradually declined over time. The figures and tables we present do not include any assessment of the implications of changes in the attendance rate.
Data source: HUNT
Description
The Health Survey in Nord Trøndelag (HUNT) began with HUNT1 in 1984-86 and consists of repeated health surveys performed on the population of Nord Trøndelag county. The last two studies are particularly relevant to the period WHO would like Member States to report on: 2010-2030. HUNT2 (1995-97) covered over 65 000 individuals aged 20 and older and had an attendance rate of 70 per cent. HUNT3 (2006-08) covered over 51 000 individuals aged 20 and older and had an attendance rate of 54 per cent. HUNT4 (2017-2019) covered over 56 000 individuals aged 20 and older and had an attendance rate of 54 per cent.
Effect measure
- Mean measured systolic blood pressure for 10-year age groups of women and men, in mm Hg.
Interpretation and sources of error
The higher age groups contain many individuals who use antihypertensive drugs. This is one of the contributing factors to lowering blood pressure levels in the population.
The blood pressure level among the younger age groups, within which few individuals use antihypertensive drugs, may give the impression that the blood pressure level is not affected by the use of medication.
Global indicator definition
WHO’s definition of the indicator
Indicator 11. Age-standardised mean systolic blood pressure in persons aged 18+ years.
National adaptation
The national data are shown in gender and age groups instead of age-standardised figures.