Total cholesterol level (Indicator 17)
Last update
The indicator describes the following: Mean total cholesterol in adults.
Results
The mean total cholesterol level has fallen during the period 1995-2019 in all age groups. This is shown by the results from the Tromsø Study and the Health Survey in Nord Trøndelag (HUNT). The higher age groups contain many individuals who use cholesterol-lowering medicines.
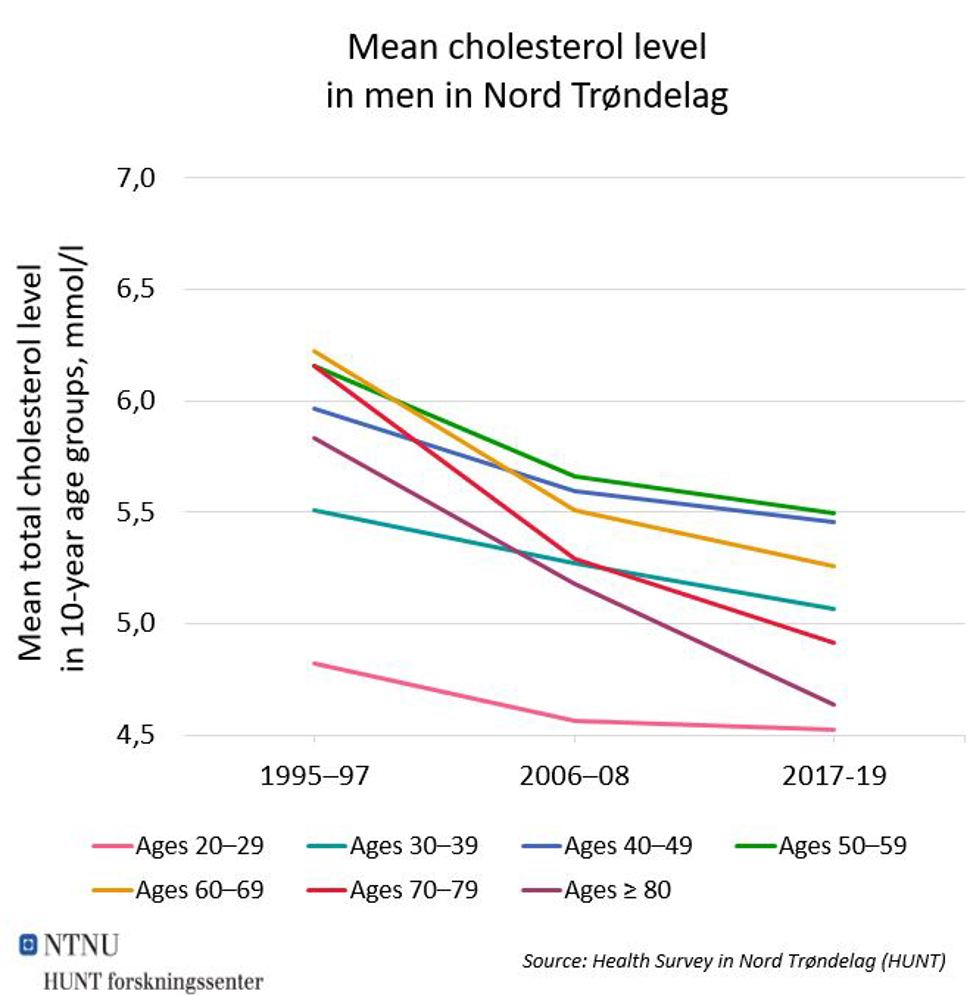
Figure 1: Mean total cholesterol level within 10-year age groups of men in Nord Trøndelag, in mmol/l. Source: Health Survey in Nord Trøndelag (HUNT).
|
1995–97 |
2006–08 |
2017-19 |
|
|
Ages 20–29 |
4.8 |
4.6 |
4.5 |
|
Ages 30–39 |
5.5 |
5.3 |
5.1 |
|
Ages 40–49 |
6.0 |
5.6 |
5.5 |
|
Ages 50–59 |
6.2 |
5.7 |
5.5 |
|
Ages 60–69 |
6.2 |
5.5 |
5.3 |
|
Ages 70–79 |
6.2 |
5.3 |
4.9 |
|
Ages ≥ 80 |
5.8 |
5.2 |
4.6 |
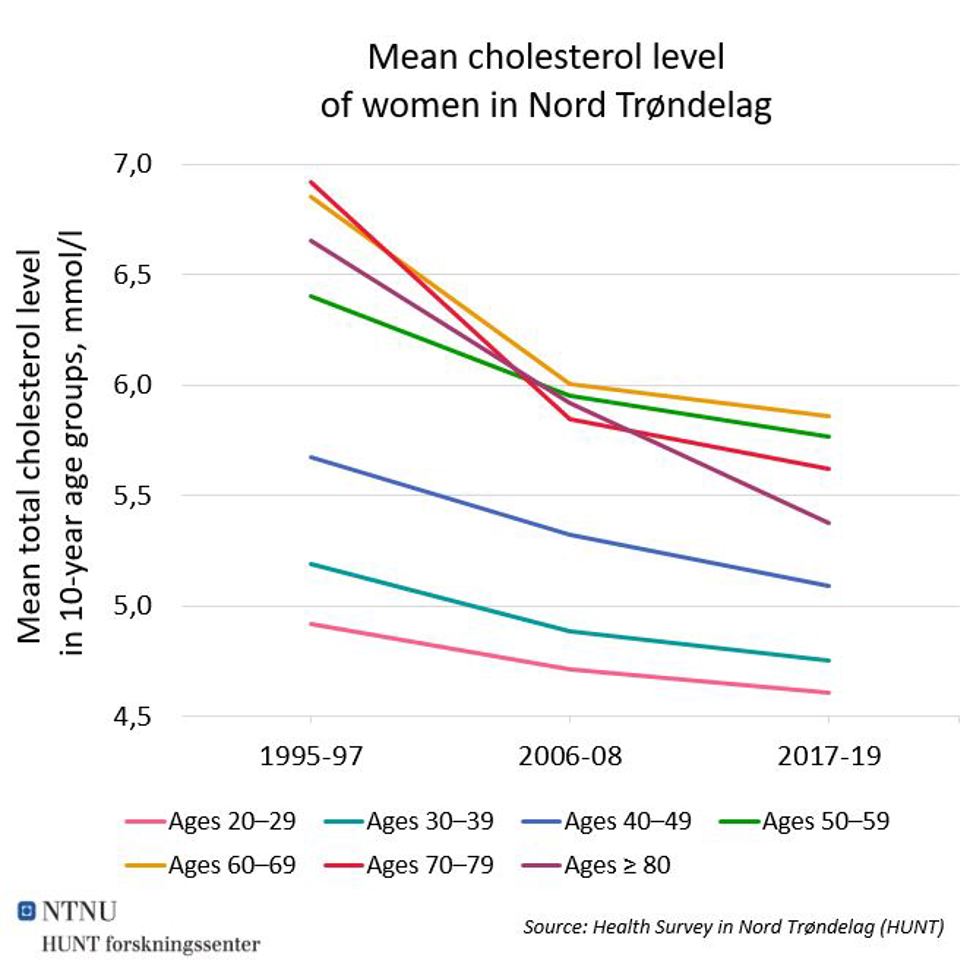
Figure 2: Mean total cholesterol level within 10-year age groups of women in Nord Trøndelag, in mmol/l. Source: Health Survey in Nord Trøndelag (HUNT).
|
1995–97 |
2006–08 |
2017-19 |
|
|
Ages 20–29 |
4.9 |
4.7 |
4.6 |
|
Ages 30–39 |
5.2 |
4.9 |
4.8 |
|
Ages 40–49 |
5.7 |
5.3 |
5.1 |
|
Ages 50–59 |
6.4 |
6.0 |
5.8 |
|
Ages 60–69 |
6.9 |
6.0 |
5.9 |
|
Ages 70–79 |
6.9 |
5.8 |
5.6 |
|
Ages ≥ 80 |
6.7 |
5.9 |
5.4 |
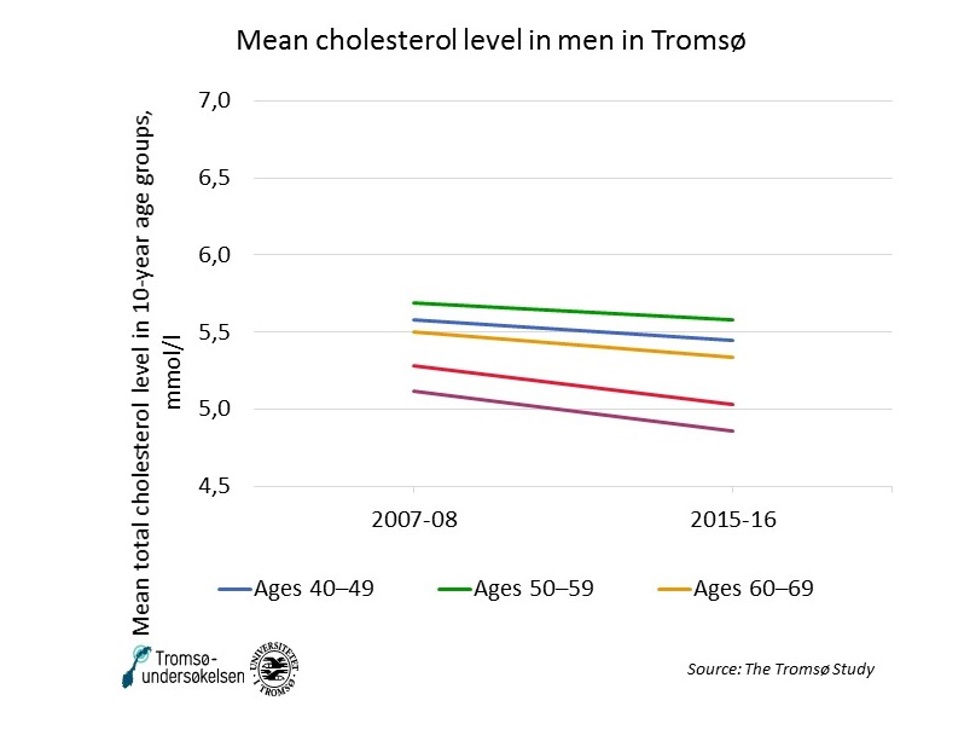
Figure 3: Mean total cholesterol level within 10-year age groups of men in Tromsø, in mmol/l. Source: Tromsø Study.
|
|
2007–08 |
2015–16 |
|
Ages 30–39 |
5.2 |
|
|
Ages 40–49 |
5.6 |
5.5 |
|
Ages 50–59 |
5.7 |
5.6 |
|
Ages 60–69 |
5.5 |
5.3 |
|
Ages 70–79 |
5.3 |
5.0 |
|
Ages ≥ 80 |
5.1 |
4.9 |
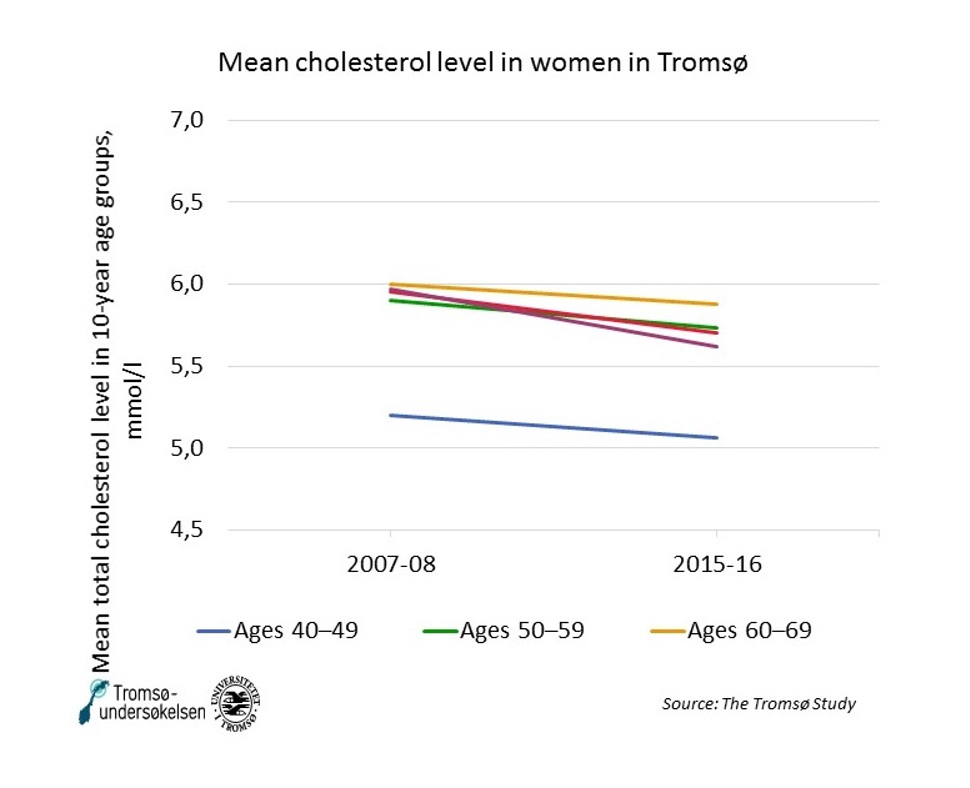
Figure 4: Mean total cholesterol level within 10-year age groups of women in Tromsø, in mmol/l. Source: Tromsø Study.
|
|
2007–08 |
2015–16 |
|
Ages 30–39 |
4.8 |
|
|
Ages 40–49 |
5.2 |
5.1 |
|
Ages 50–59 |
5.9 |
5.7 |
|
Ages 60–69 |
6.0 |
5.9 |
|
Ages 70–79 |
6.0 |
5.7 |
|
Ages ≥ 80 |
6.0 |
5.6 |
Data sources
The data sources for this indicator are the Tromsø Study and HUNT
A description and definitions follow below.
Data source: Tromsø Study
Description
The Tromsø Study started in 1974 and consists of repeated health checks on Tromsø municipality’s population. The last two studies are particularly relevant to the period WHO would like Member States to report on: 2010-2025. Tromsø 6 (2007-2008) included almost 13,000 adults between the ages of 30 and 87, and had an attendance rate of 63 per cent. Tromsø 7 (2015-2016) included more than 21000 adults aged 40 and older, and had an attendance rate of 65 per cent.
Effect measure
- Mean total cholesterol level within 10-year age groups of men and women, in mmol/l.
Interpretation and sources of error
The higher age groups contain many individuals who use cholesterol-lowering drugs. This is one of the contributing factors to lowering cholesterol levels throughout the population.
The cholesterol level among the youngest age groups, within which few individuals use cholesterol-lowering drugs, may give the impression that the trend in cholesterol level is not affected by the use of medication.
The proportion of individuals attending health checks has gradually declined over time. The figures and tables we present do not include any assessment of the possible implications of changes in the attendance rate.
Data source: HUNT
Description
The Health Survey in Nord Trøndelag (HUNT) began with HUNT1 in 1984-86 and consists of repeated health checks performed on the population of Nord Trøndelag county. The last two studies are particularly relevant to the period WHO would like Member States to report on: 2010-2025. HUNT2 (1995-97) covered over 65 000 individuals aged 20 and older and had an attendance rate of 70 per cent. HUNT3 (2006-08) covered over 51 000 individuals aged 20 and older and had an attendance rate of 54 per cent. HUNT4 is being conducted between 2017 and 2019 and will contribute new data.
Effect measure
- Mean total cholesterol level within 10-year age groups of men and women, in mmol/l.
Interpretation and sources of error
The higher age groups contain many individuals who use cholesterol-lowering drugs. This is one of the contributing factors to lowering cholesterol levels throughout the population.
The cholesterol level among the youngest age groups, within which few individuals use cholesterol-lowering drugs, may give the impression that the trend in cholesterol level is not affected by the use of medication.
The proportion of individuals attending health checks has gradually declined over time. The figures and tables we present do not include any assessment of the possible implications of changes in the attendance rate.
Global indicator definition
WHO’s definition of the indicator
Indicator 17. Age-standardised prevalence of raised total cholesterol among persons aged 18+ years (defined as total cholesterol ≥ 5.0 mmol/l or 190 mg/dl); and mean total cholesterol concentration.