Total alcohol consumption per capita (Indicator 3)
Last update
The indicator describes the following: Total recorded alcohol sales per capita (aged 15+) during one calendar year, in litres of pure alcohol.
This indicator is part of Target (2): At least 20 per cent reduction in harmful alcohol consumption from 2010 to 2030.
Alcohol consumption may be divided into two main parts. The first is what is often called “recorded consumption”, that is, consumption recorded by way of alcohol sales at shops, off-licences, cafes, restaurants, bars etc. The second part includes unrecorded consumption derived from a combination of: legal tourist imports and home distillation, legal or illegal border trading, illegal import (smuggling) and illegal home distillation (illicit distilling).
Results
Here we present the sum of recorded alcohol consumption, divided by the number of individuals aged 15+.
Total sales of alcohol per person aged 15+ were relatively stable until the middle of the 1990s but increased substantially up to 2008. This may be mainly attributed to the rise in wine sales. Sales of beer and spirits have somewhat declined over the last few years. There was an overall decline from 2008 to 2014, then the sales were quite stable until 2019. In 2020 and 2021, they were higher than in previous years. This was most likely due to interventions to limit the spread of COVID-19. Travel restrictions especially, resulted in a shift in sales of alcohol from international to domestic sales. However, results from the population-based Norwegian Survey of Alcohol, Tobacco and Drugs, suggest no change in self-reported alcohol consumption over time.
In 2022, the registered alcohol sales fell somewhat in line with the increase in travels abroad. However, cross-border sales in alcohol and duty-free sales at Norwegian airports are not at the same level as before the pandemic.

Total alcohol | Spirits | Wine | Beer | Alcopop | |
1980 | 5.98 | 2.46 | 0.75 | 2.77 |
|
1981 | 5.32 | 2.06 | 0.69 | 2.57 |
|
1982 | 4.83 | 1.57 | 0.57 | 2.69 |
|
1983 | 4.85 | 1.63 | 0.65 | 2.57 |
|
1984 | 4.98 | 1.62 | 0.71 | 2.65 |
|
1985 | 5.22 | 1.77 | 0.82 | 2.63 |
|
1986 | 5.27 | 1.61 | 0.83 | 2.83 |
|
1987 | 5.38 | 1.63 | 0.93 | 2.82 |
|
1988 | 5.26 | 1.45 | 0.97 | 2.84 |
|
1989 | 5.08 | 1.33 | 0.97 | 2.78 |
|
1990 | 4.99 | 1.24 | 0.95 | 2.81 |
|
1991 | 4.90 | 1.12 | 0.93 | 2.85 |
|
1992 | 4.67 | 1 | 0.91 | 2.76 |
|
1993 | 4.55 | 0.96 | 0.92 | 2.67 |
|
1994 | 4.74 | 1 | 0.99 | 2.75 |
|
1995 | 4.79 | 1 | 1.04 | 2.75 |
|
1996 | 5.04 | 1.02 | 1.12 | 2.88 | 0.02 |
1997 | 5.28 | 1.01 | 1.28 | 2.95 | 0.04 |
1998 |
|
|
|
|
|
1999 | 5.45 | 1.05 | 1.49 | 2.84 | 0.06 |
2000 | 5.66 | 1.05 | 1.62 | 2.93 | 0.07 |
2001 | 5.49 | 1 | 1.60 | 2.82 | 0.07 |
2002 | 5.89 | 1.12 | 1.81 | 2.89 | 0.07 |
2003 | 6.03 | 1.22 | 1.84 | 2.76 | 0.22 |
2004 | 6.22 | 1.25 | 1.90 | 2.96 | 0.11 |
2005 | 6.37 | 1.28 | 2 | 2.98 | 0.11 |
2006 | 6.46 | 1.30 | 2.05 | 3.01 | 0.11 |
2007 | 6.60 | 1.35 | 2.11 | 3.02 | 0.12 |
2008 | 6.75 | 1.33 | 2.23 | 3.06 | 0.13 |
2009 | 6.68 | 1.31 | 2.28 | 2.96 | 0.13 |
2010 | 6.59 | 1.25 | 2.29 | 2.91 | 0.14 |
2011 | 6.43 | 1.18 | 2.30 | 2.83 | 0.13 |
2012 | 6.21 | 1.11 | 2.29 | 2.67 | 0.14 |
2013 | 6.22 | 1.09 | 2.30 | 2.68 | 0.14 |
2014 | 6.06 | 1.04 | 2.25 | 2.62 | 0.15 |
2015 | 5.97 | 1.03 | 2.22 | 2.57 | 0.15 |
2016 | 6.03 | 1.01 | 2.21 | 2.65 | 0.16 |
2017 | 6.00 | 1.01 | 2.19 | 2.63 | 0.17 |
2018 | 6.02 | 0.97 | 2.20 | 2.66 | 0.19 |
2019 | 6.05 | 1.00 | 2.23 | 2.63 | 0.19 |
2020 | 7.23 | 1.23 | 2.94 | 2.83 | 0.23 |
2021 | 7.44 | 1.27 | 2.96 | 2.94 | 0.27 |
2022 | 6,64 | 1,14 | 2,52 | 2,73 | 0,26 |
2023 | 6,37 | 1,06 | 2,43 | 2,61 | 0,26 |
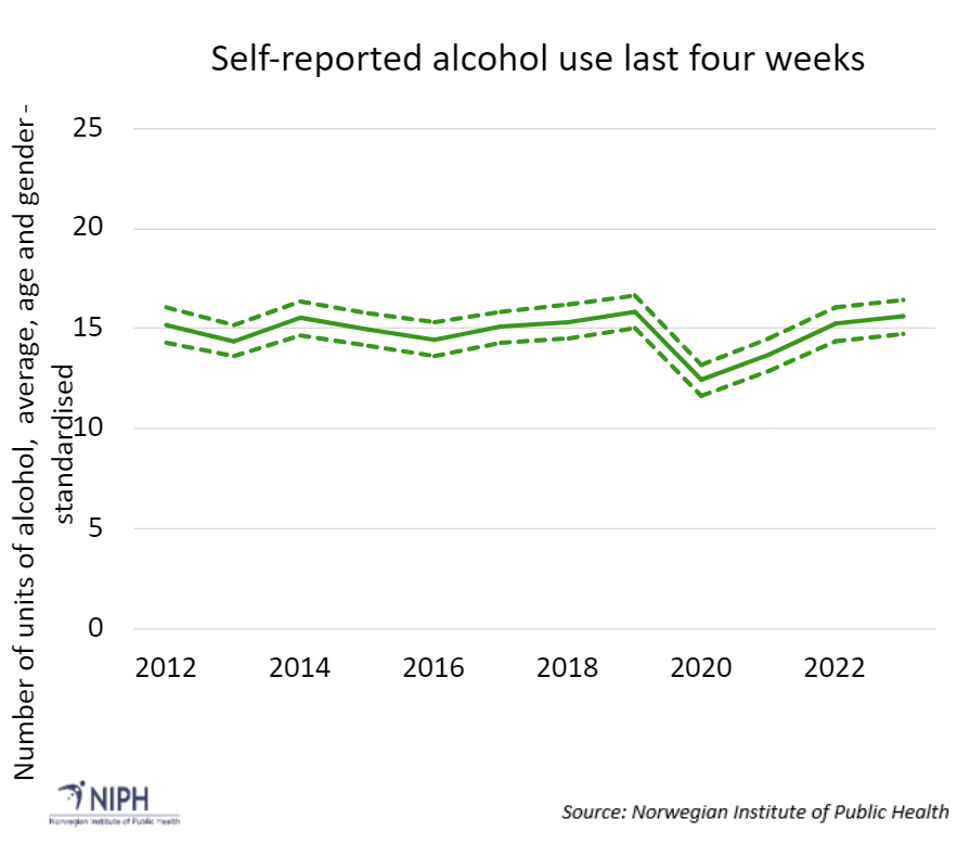
The average self-reported alcohol consumption for Norwegians aged 16 to 79 years was stabile during this time period, except for the pandemic years 2020 and 2021 when consumption was lower.
In 2020 and 2021, registered per capita sales of alcohol were higher than in preceding years, which can be attributed to travel restrictions during the pandemic.

2012 | 2013 | 2014 | 2015 | 2016 | 2017 | 2018 | 2019 | 2020 | 2021 | 2022 | 2023 | 2024 | |
Number of alcohol units over four weeks | 15 | 14 | 16 | 15 | 14 | 15 | 15 | 16 | 12 | 14 | 15 | 16 | 16 |
Data sources
The data sources for this indicator are the Statistics on alcohol sales compiled by Statistics Norway and the Norwegian Survey of Alcohol, Tobacco and Drugs. A description and definitions follow below.
Data source: Alcohol sales
Description
The statistics compiled by Statistics Norway include recorded sales of alcohol and are based on data from the Directorate of Customs and Excise, as well as recorded imports.
Effect measure
- Average reported alcohol sales per person aged 15+, in litres of pure alcohol (alcohol litres) per year.
Unrecorded consumption in the form of home-distilled alcohol, tourist imports, duty-free sales or smuggled goods is not included.
Data source: Norwegian Survey of Alcohol, Tobacco and Drugs
Due to the changes in alcohol sales during the COVID-19 pandemic, the Norwegian Survey of Alcohol, Tobacco and Drugs will serve as an additional data source for this indicator.
Description
The Norwegian Survey of Alcohol, Tobacco and Drugs is a mixed mode nationwide survey of alcohol, tobacco and drug use among individuals aged 16-79, and undertaken by Statistics Norway on behalf of the Norwegian Institute of Public Health. The survey is conducted on a representative sample of people who are selected from the National Population Register and interviewed via telephone or web. The survey enables trends in alcohol use to be traced back to 2012.
National adaptation to global indicators
WHO’s definition of the indicator
Indicator 3. Total (recorded and unrecorded) alcohol per capita (aged 15+ years old) consumption within a calendar year in litres of pure alcohol, as appropriate, within the national context.
National adaptation
WHO’s indicator applies to both recorded and unrecorded total alcohol consumption per capita per year. The Norwegian indicator only covers recorded alcohol consumption.

